I don’t really know what to make of this, and I don’t have access to the original source data to verify or question it. The birth & death stats in the following table are from the CDC, here: https://www.cdc.gov/nchs/nvss/vsrr/provisional-tables.htm
| Year | Month | Number of Live Births | Number of Deaths | Number of Infant Deaths | 12 Month-ending Number of Live Births | 12 Month-ending Number of Deaths | 12 Month-ending Number of Infant Deaths |
| 2020 | January | 305,000 | 264,000 | 1,800 | 3,742,000 | 2,861,000 | 21,000 |
| 2020 | February | 283,000 | 244,000 | 1,700 | 3,744,000 | 2,872,000 | 21,100 |
| 2020 | March | 302,000 | 269,000 | 1,700 | 3,742,000 | 2,887,000 | 20,900 |
| 2020 | April | 290,000 | 322,000 | 1,600 | 3,733,000 | 2,974,000 | 20,800 |
| 2020 | May | 301,000 | 280,000 | 1,700 | 3,718,000 | 3,017,000 | 20,700 |
| 2020 | June | 302,000 | 250,000 | 1,700 | 3,716,000 | 3,041,000 | 20,500 |
| 2020 | July | 321,000 | 278,000 | 1,600 | 3,704,000 | 3,091,000 | 20,400 |
| 2020 | August | 319,000 | 277,000 | 1,600 | 3,681,000 | 3,140,000 | 20,200 |
| 2020 | September | 311,000 | 257,000 | 1,600 | 3,666,000 | 3,174,000 | 20,100 |
| 2020 | October | 305,000 | 273,000 | 1,600 | 3,646,000 | 3,209,000 | 20,000 |
| 2020 | November | 282,000 | 302,000 | 1,600 | 3,630,000 | 3,272,000 | 19,900 |
| 2020 | December | 290,000 | 366,000 | 1,500 | 3,611,000 | 3,382,000 | 19,600 |
| 2021 | January | 277,000 | 373,000 | 1,700 | 3,583,000 | 3,491,000 | 19,500 |
| 2021 | February | 266,000 | 282,000 | 1,500 | 3,567,000 | 3,528,000 | 19,300 |
| 2021 | March | 302,000 | 270,000 | 1,700 | 3,567,000 | 3,529,000 | 19,300 |
| 2021 | April | 293,000 | 256,000 | 1,700 | 3,570,000 | 3,464,000 | 19,400 |
| 2021 | May | 301,000 | 258,000 | 1,700 | 3,569,000 | 3,442,000 | 19,400 |
| 2021 | June | 313,000 | 245,000 | 1,600 | 3,581,000 | 3,436,000 | 19,300 |
| 2021 | July | 326,000 | 257,000 | 1,700 | 3,585,000 | 3,415,000 | 19,400 |
| 2021 | August | 330,000 | 303,000 | 1,700 | 3,595,000 | 3,442,000 | 19,400 |
| 2021 | September | 325,000 | 311,000 | 1,700 | 3,609,000 | 3,496,000 | 19,500 |
| 2021 | October | 315,000 | 299,000 | 1,700 | 3,619,000 | 3,522,000 | 19,600 |
| 2021 | November | 301,000 | 288,000 | 1,600 | 3,638,000 | 3,507,000 | 19,600 |
| 2021 | December | 310,000 | 318,000 | 1,700 | 3,658,000 | 3,459,000 | 19,700 |
| Mean | 302,917 | 285,083 | 1,654 | 3,644,750 | 3,277,125 | 19,942 | |
| StdDev | 15,845 | 33,612 | 71 | 62,293 | 231,300 | 596 | |
| Mean+1StdDev | 318,762 | 318,695 | 1,725 | 3,707,043 | 3,508,425 | 20,537 | |
| Mean-11tdDev | 287,071 | 251,472 | 1,584 | 3,582,457 | 3,045,825 | 19,346 | |
| Last month Z score | 0.447 | 0.979 | 0.649 | 0.213 | 0.786 | 0.406 | |
A graph of the numbers shows visually that the numbers changed, but not massively, and the trend was upwards for death BEFORE the vax, and flattened AFTER.
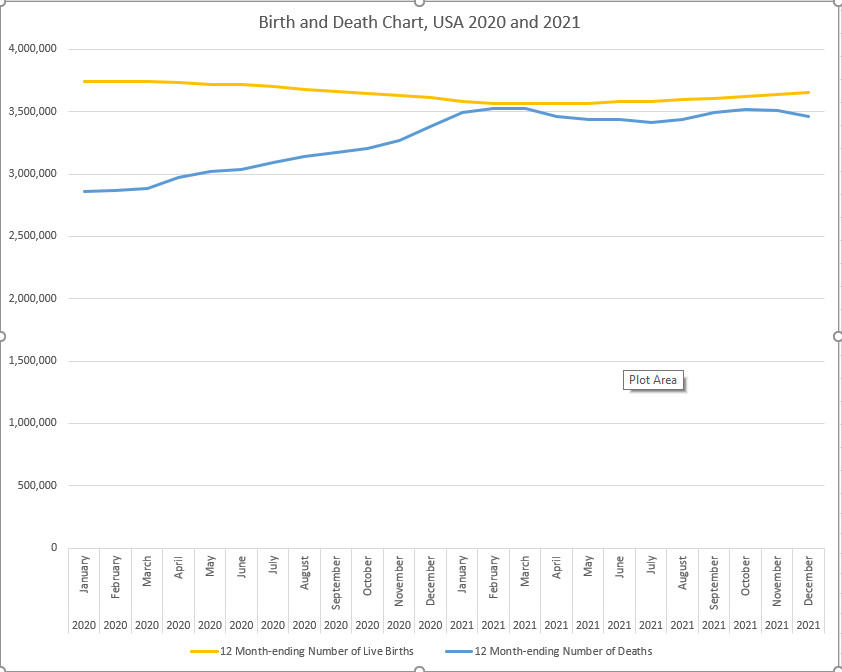
They show no change in trend in any of the major population birth/death stats, in spite of lots of “died suddenly” in the news, record numbers of athletes keeling over, life insurance companies reporting huge numbers above normal on working-age insurance payouts, and all the reported Covid19 Vaxx reported deaths. So… are our perceptions wrong, or are these official numbers being seriously fudged to hide what’s really going on? How would someone audit these numbers to find out if they are accurately reflecting what is really going on out there in the real world? The most recent reported month is within one standard deviation (SD) of the mean, most within one SD, meaning the number reported is not really unusual or remarkable at all. IF these numbers are accurate, then our perceptions of how deadly the vax and covid is are skewed. If they are being seriously fudged to cover up the actual birth and death rate changes, then the conspiracy is huge, and the prosecution needs to be vigorous and penalties imposed harsh.
Related website, all cause excess mortality.
Thoughts on how to verify / audit?