Looking at the most recent CDC numbers here, a few things stand out. First of all, pretty much everything is flatlined within less than one standard deviation of mean since Jan 2020, in spite of all the news stories of “Died Suddenly,” athletes collapsing, empty neonatal wards, booming business from mortuary companies, huge increases in cases of child deaths being reported, huge increases in life insurance payouts and disability enrolment, etc. All that death and destruction reported, and…. official numbers are flat.
Here is the data since 2020. They update quarterly, with data from the previous quarter.
| Year | Month | Number of Live Births | Number of Deaths | Number of Infant Deaths | 12 Month-ending Number of Live Births | 12 Month-ending Number of Deaths | 12 Month-ending Number of Infant Deaths |
| 2020 | January | 305,000 | 264,000 | 1,800 | 3,742,000 | 2,861,000 | 21,000 |
| 2020 | February | 283,000 | 244,000 | 1,700 | 3,744,000 | 2,872,000 | 21,100 |
| 2020 | March | 302,000 | 269,000 | 1,700 | 3,742,000 | 2,887,000 | 20,900 |
| 2020 | April | 290,000 | 322,000 | 1,600 | 3,733,000 | 2,974,000 | 20,800 |
| 2020 | May | 301,000 | 280,000 | 1,700 | 3,718,000 | 3,017,000 | 20,700 |
| 2020 | June | 302,000 | 250,000 | 1,700 | 3,716,000 | 3,041,000 | 20,500 |
| 2020 | July | 321,000 | 278,000 | 1,600 | 3,704,000 | 3,091,000 | 20,400 |
| 2020 | August | 319,000 | 277,000 | 1,600 | 3,681,000 | 3,140,000 | 20,200 |
| 2020 | September | 311,000 | 257,000 | 1,600 | 3,666,000 | 3,174,000 | 20,100 |
| 2020 | October | 305,000 | 273,000 | 1,600 | 3,646,000 | 3,209,000 | 20,000 |
| 2020 | November | 282,000 | 302,000 | 1,600 | 3,630,000 | 3,272,000 | 19,900 |
| 2020 | December | 290,000 | 366,000 | 1,500 | 3,611,000 | 3,382,000 | 19,600 |
| 2021 | January | 277,000 | 373,000 | 1,700 | 3,583,000 | 3,491,000 | 19,500 |
| 2021 | February | 266,000 | 282,000 | 1,500 | 3,567,000 | 3,528,000 | 19,300 |
| 2021 | March | 302,000 | 270,000 | 1,700 | 3,567,000 | 3,529,000 | 19,300 |
| 2021 | April | 293,000 | 256,000 | 1,700 | 3,570,000 | 3,464,000 | 19,400 |
| 2021 | May | 301,000 | 258,000 | 1,700 | 3,569,000 | 3,442,000 | 19,400 |
| 2021 | June | 313,000 | 245,000 | 1,600 | 3,581,000 | 3,436,000 | 19,300 |
| 2021 | July | 326,000 | 257,000 | 1,700 | 3,585,000 | 3,415,000 | 19,400 |
| 2021 | August | 330,000 | 303,000 | 1,700 | 3,595,000 | 3,442,000 | 19,400 |
| 2021 | September | 325,000 | 311,000 | 1,700 | 3,609,000 | 3,496,000 | 19,500 |
| 2021 | October | 315,000 | 299,000 | 1,700 | 3,619,000 | 3,522,000 | 19,600 |
| 2021 | November | 301,000 | 288,000 | 1,600 | 3,638,000 | 3,507,000 | 19,600 |
| 2021 | December | 310,000 | 318,000 | 1,700 | 3,658,000 | 3,459,000 | 19,700 |
| 2022 | January | 294,000 | 368,000 | 1,600 | 3,675,000 | 3,459,000 | 19,900 |
| 2022 | February | 275,000 | 288,000 | 1,400 | 3,684,000 | 3,465,000 | 19,900 |
| 2022 | March | 306,000 | 266,000 | 1,600 | 3,688,000 | 3,461,000 | 19,800 |
| 2022 | April | 288,000 | 245,000 | 1,600 | 3,687,000 | 3,453,000 | 19,800 |
| 2022 | May | 297,000 | 254,000 | 1,700 | 3,683,000 | 3,449,000 | 19,800 |
| 2022 | June | 304,000 | 247,000 | 1,600 | 3,674,000 | 3,451,000 | 19,800 |
| 2022 | July | 321,000 | 260,000 | 1,800 | 3,673,000 | 3,457,000 | 20,100 |
| 2022 | August | 336,000 | 259,000 | 1,800 | 3,679,000 | 3,414,000 | 20,200 |
| 2022 | September | 312,000 | 251,000 | 1,700 | 3,665,000 | 3,353,000 | 20,300 |
| 2022 | October | 306,000 | 265,000 | 1,800 | 3,657,000 | 3,318,000 | 20,300 |
| 2022 | November | 307,000 | 268,000 | 1,700 | 3,661,000 | 3,298,000 | 20,400 |
| 2022 | December | 314,000 | 300,000 | 1,700 | 3,664,000 | 3,279,000 | 20,500 |
| 2023 | January | 299,000 | 288,000 | 1,700 | 3,668,000 | 3,198,000 | 20,500 |
| 2023 | February | 270,000 | 248,000 | 1,400 | 3,662,000 | 3,156,000 | 20,400 |
| 2023 | March | 298,000 | 266,000 | 1,600 | 3,653,000 | 3,155,000 | 20,400 |
| Mean | 302,487 | 279,872 | 1,651 | 3,655,051 | 3,308,128 | 20,018 | |
| StdDev | 15,950 | 32,997 | 93 | 51,014 | 198,339 | 506 | |
| Mean + 1 StdDev | 318,437 | 312,868 | 1,744 | 3,706,065 | 3,506,467 | 20,524 | |
| Mean-1 StdDev | 286,537 | 246,875 | 1,558 | 3,604,037 | 3,109,789 | 19,512 | |
| Last month Z score | (0.281) | (0.420) | (0.551) | (0.040) | (0.772) | +0.755 |
Number of Live Births is downs a meager .28 StdDev from mean, in spite of numbers like the following reported in other countries. Are we uniquely unaffected?
In the EU Igor Chudov reports: Europe reported 35% excess deaths in the last week for which full data was available.
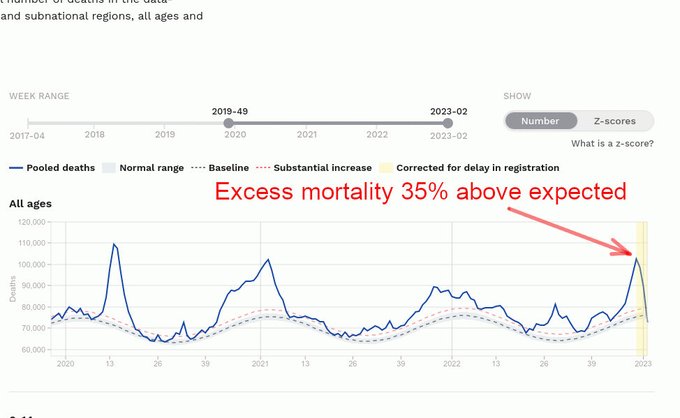
And – Germany had its HIGHEST EVER excess mortality. Over 40%!

Number of Deaths are up a paltry .42 StdDev. All thos “died suddenly” and increased life-insurance payouts and worker shortages, yet it’s just “same ol’, same ol’?” Not credible.
Number of Infant Deaths are up .55 StdDevdoesn’t reflect the number of tragic stories cropping up[, and tales of empty maternity wards.
12 Month-ending Number of Live Births pretty much flat, up .04 StdDev.
12 Month-ending Number of Deaths up only .77 StdDev, well within a normal expectation in a normal year… yet we have athletes deaths and collapsing on the field being reported virtually every day, etc. Gab groups like this catch them all the time.
An example would be her: An “unthinkable”, 26-sigma drop in the birth rate in Taiwan reduced births by 23.34% in May 2022, compared to a year ago.

12 Month-ending Number of Infant Deaths up only a bit, a small but still tragic .76 StdDev, in spite of all the news stories I’ve seen about kids and infants suddenly dying.
So it would be easy to say “these numbers look normal, within trend, why should anyone be paranoid? people are not dying all unusually, it’s just a reporting artifact.” But that only works if you trust the CDC, and they have proven to be liars and heavily biased toward the Pharma industry; they just admitted they can’t tell doctors to not prescribe ivermectin, after doctors lost their licenses for doing so, and they dismissed their “you are not a horse, y’all” as “just quips” even though people lost their jobs over it.